Planning
Overview
This page contains the scheduling for all approved work within the facility. It is designed for resource allocation and management, monitoring job progress, timelines, and departmental man-hours.
The page features four synchronized views that interact with each other, each serving a specific purpose: Filters, Table View, Gantt Chart, and Departments Hours.
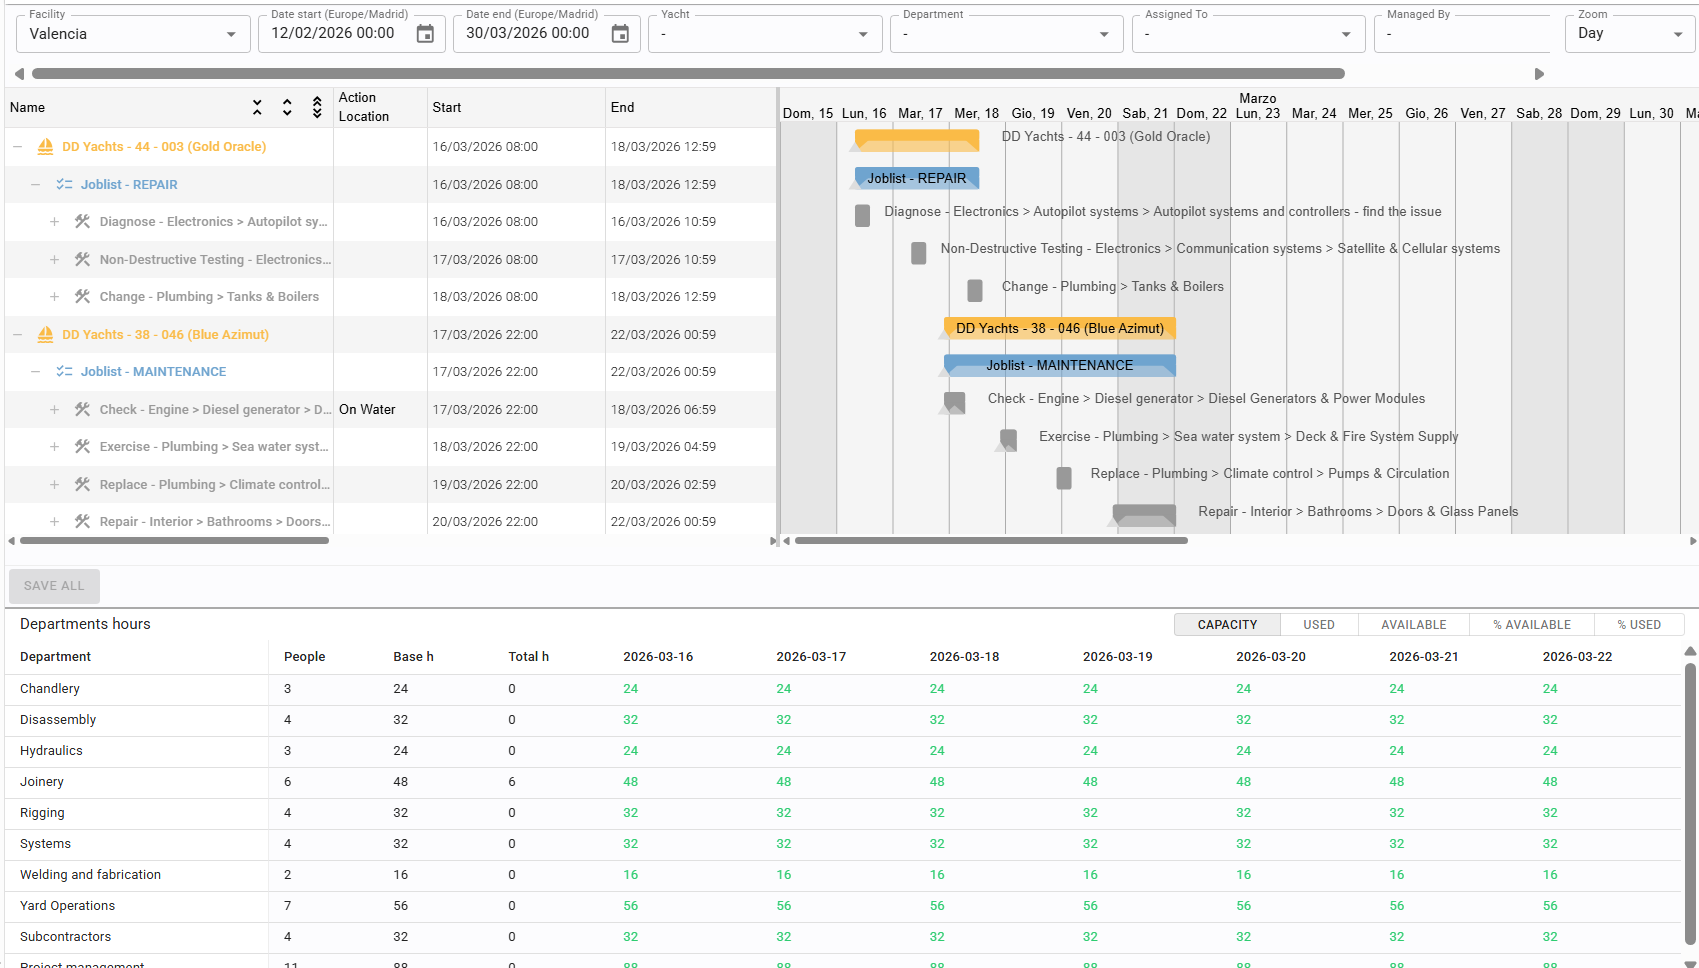
- up: FILTERS
- left: TABLE VIEW
- right: GANTT CHART
- down: DEPARTMENTS HOURS
You can expand or collapse these sections by moving the dividers between them.
Filters
In addition to the standard filters, two unique options are available in this section:
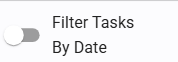
- Filter Tasks by Date: When active, it displays only specific tasks within the selected date range. When inactive, it shows the entire job or joblist associated with those tasks.
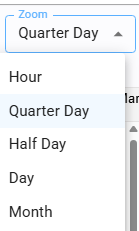
- Zoom: This filter is dedicated exclusively to adjusting the time scale of the Gantt Chart.
Table view
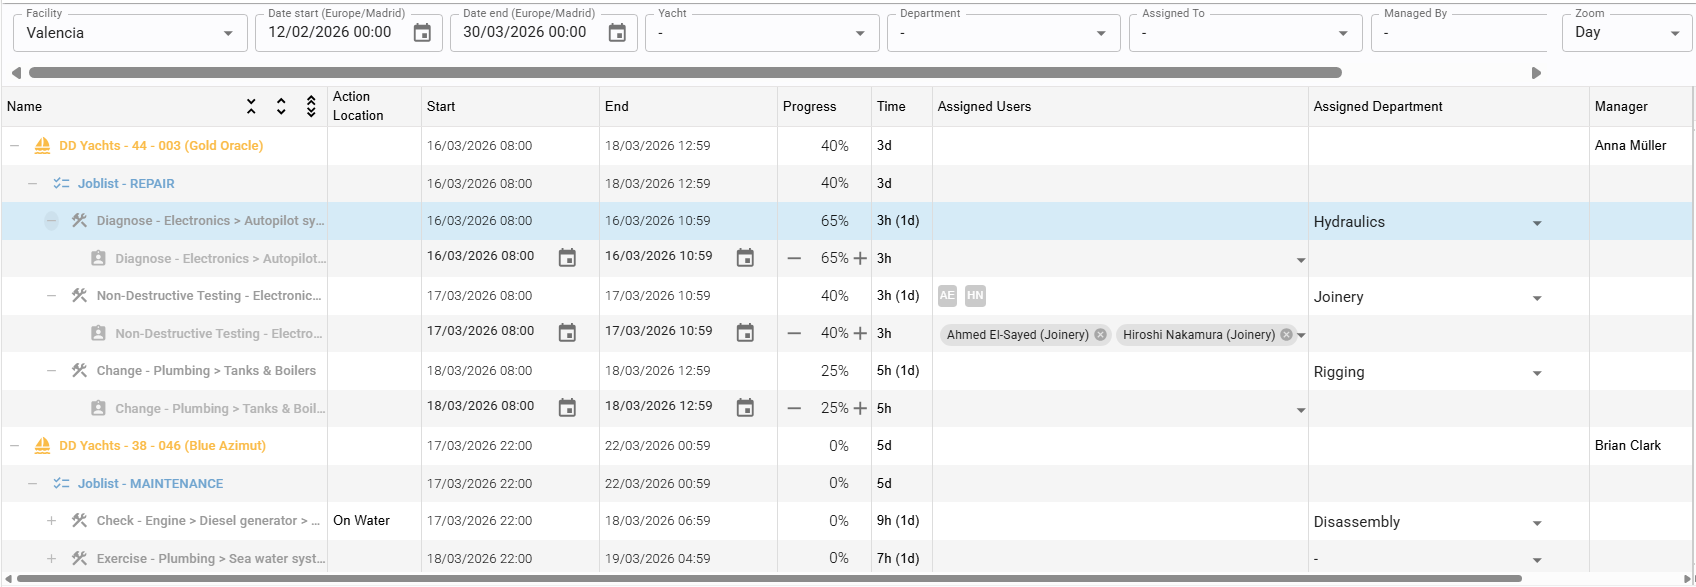
The left side of the planning interface displays information in a hierarchical structure.
Elements can be expanded or collapsed using the + and - icons next to individual items or via the icons in the first column header..
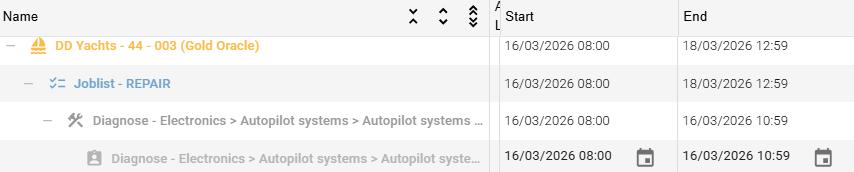
Start date and end date
Dates must be set at the Task level; the dates for Jobs, Joblists, and Boats are automatically calculated based on their underlying tasks.
Update the progress status
Progress percentage is updated at the Task level. The progress status for higher-level elements (Job/Joblist) is automatically aggregated.
Assign job to department
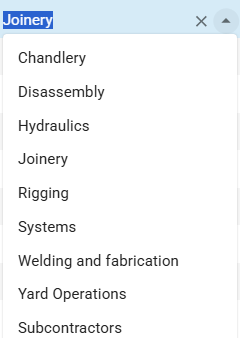
A department can be assigned at the Job level.
Once assigned, the hours associated with that job are calculated toward that department's workload.
Assign task to user
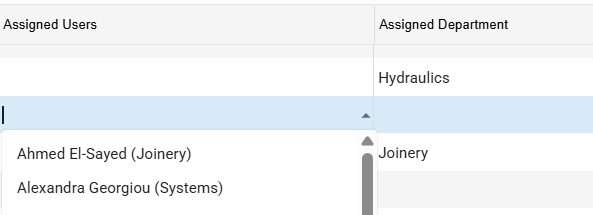
A task can be assigned to one or more users, regardless of their primary department.
Note: If an assigned user belongs to a different department, the task hours will be deducted from their original department's availability.
Gantt chart
The right section of the screen provides a graphical representation (Gantt) of the table data
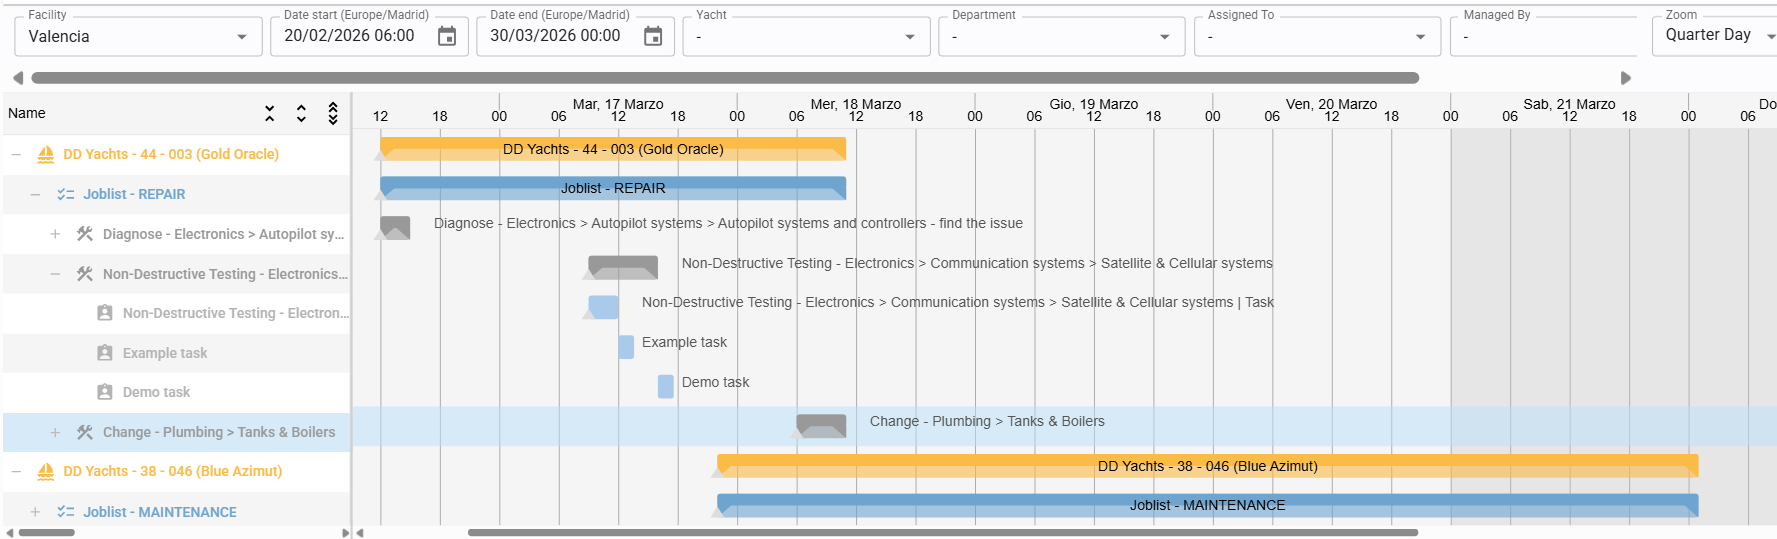
Drag and drop elements
Any element can be moved along the timeline using drag-and-drop. Related sub-elements will automatically shift to maintain the schedule's consistency.

Resize elements
The duration of any element can be extended or shortened by clicking and dragging the edges of its respective bar (or using date-time inputs in the table section).
Add job to a joblist
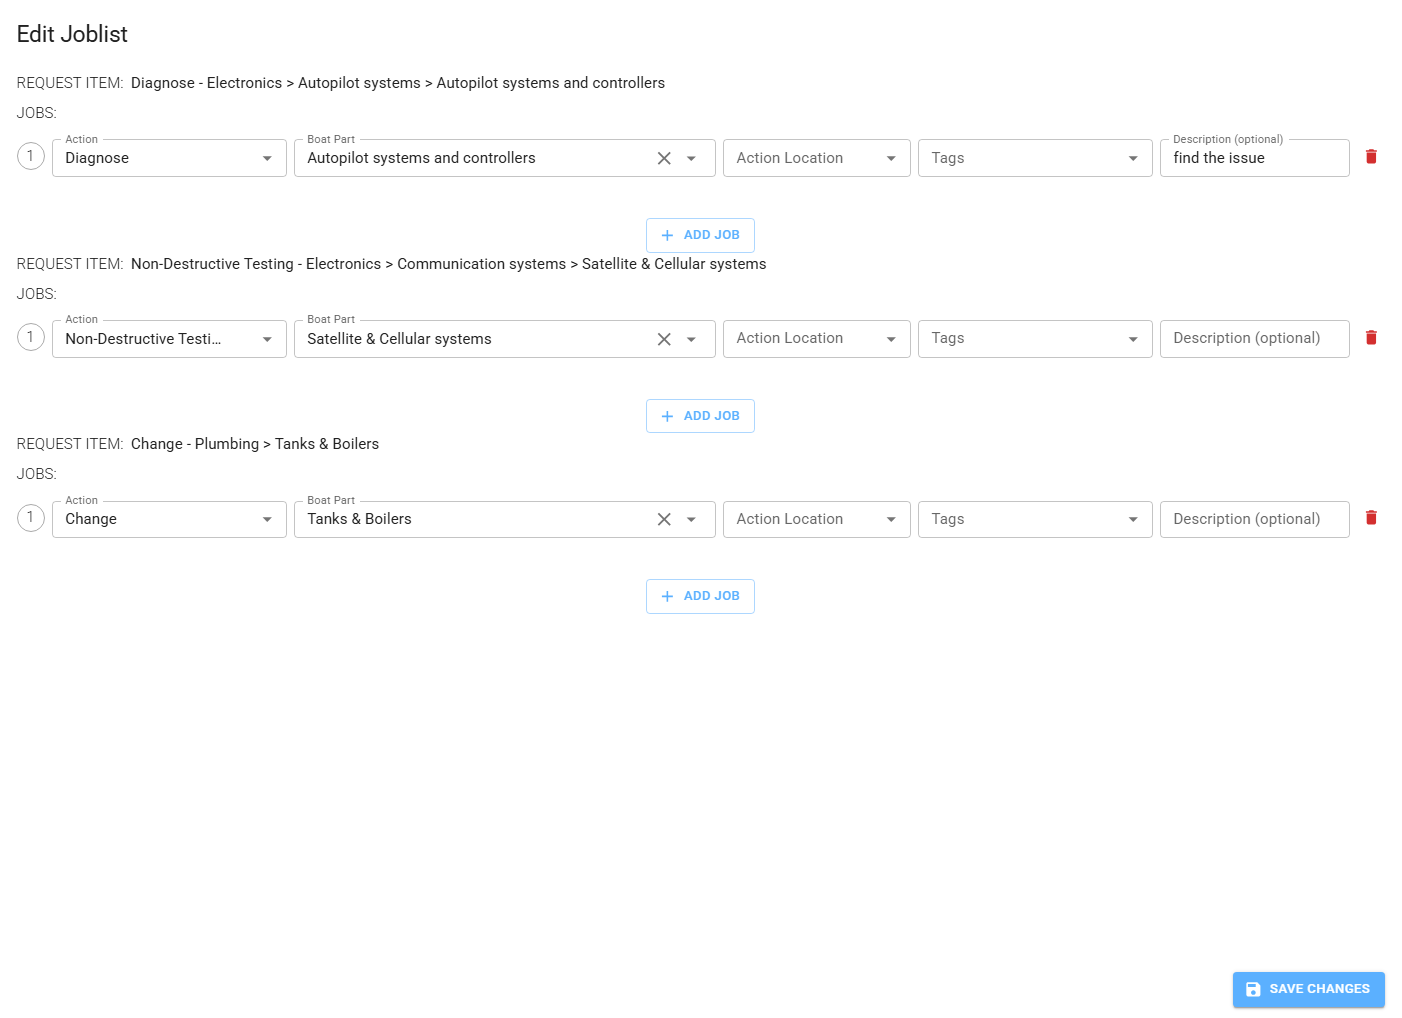
Right-clicking on a Joblist allows you to delete it or open the editor. In the editor, you can add new jobs using the "Add Job" button.
Add task to a job
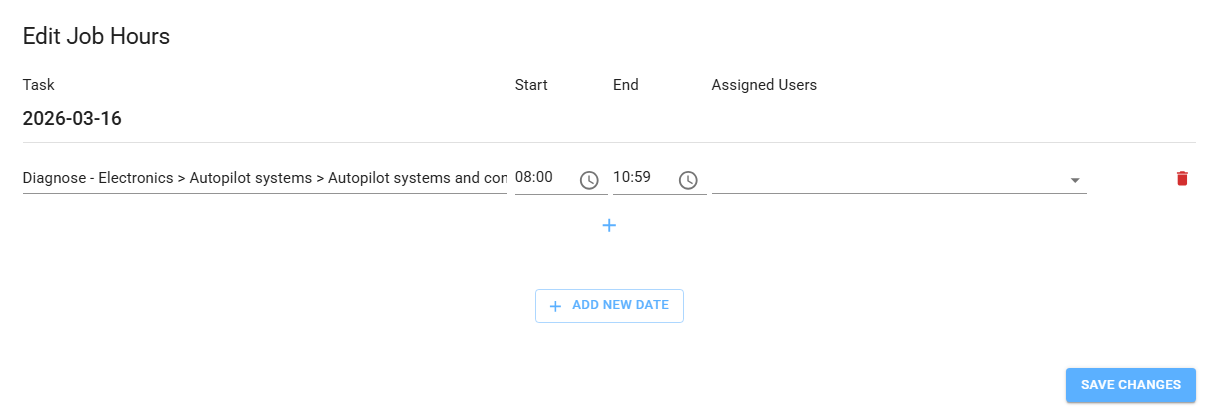
Right-clicking on a Job allows you to select "Edit Hours." Within this editor, you can add tasks on the same day using the + icon or add tasks for
different dates using the "Add New Date" button.
Move task
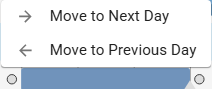
Right-clicking on a Task provides shortcuts to shift it directly to the previous or following day
Departments hours
This section displays the capacity and total man-hours of each department on a day-by-day basis.
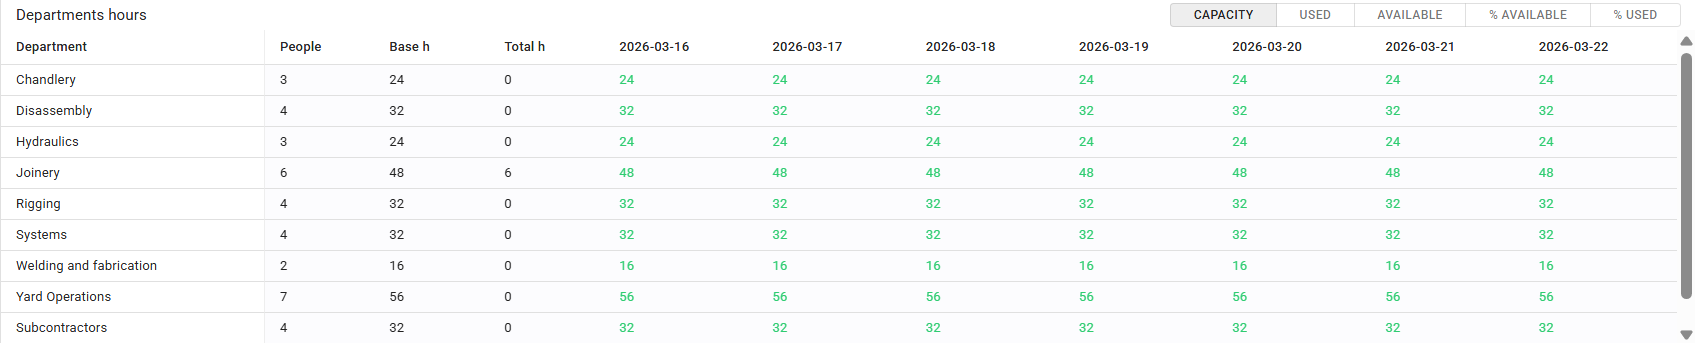
You can toggle between different data views: capacity, hours used, hours available, % available or % used
This view also tracks cross-departmental resource sharing, indicating where a department has provided staff to others or received additional resources.